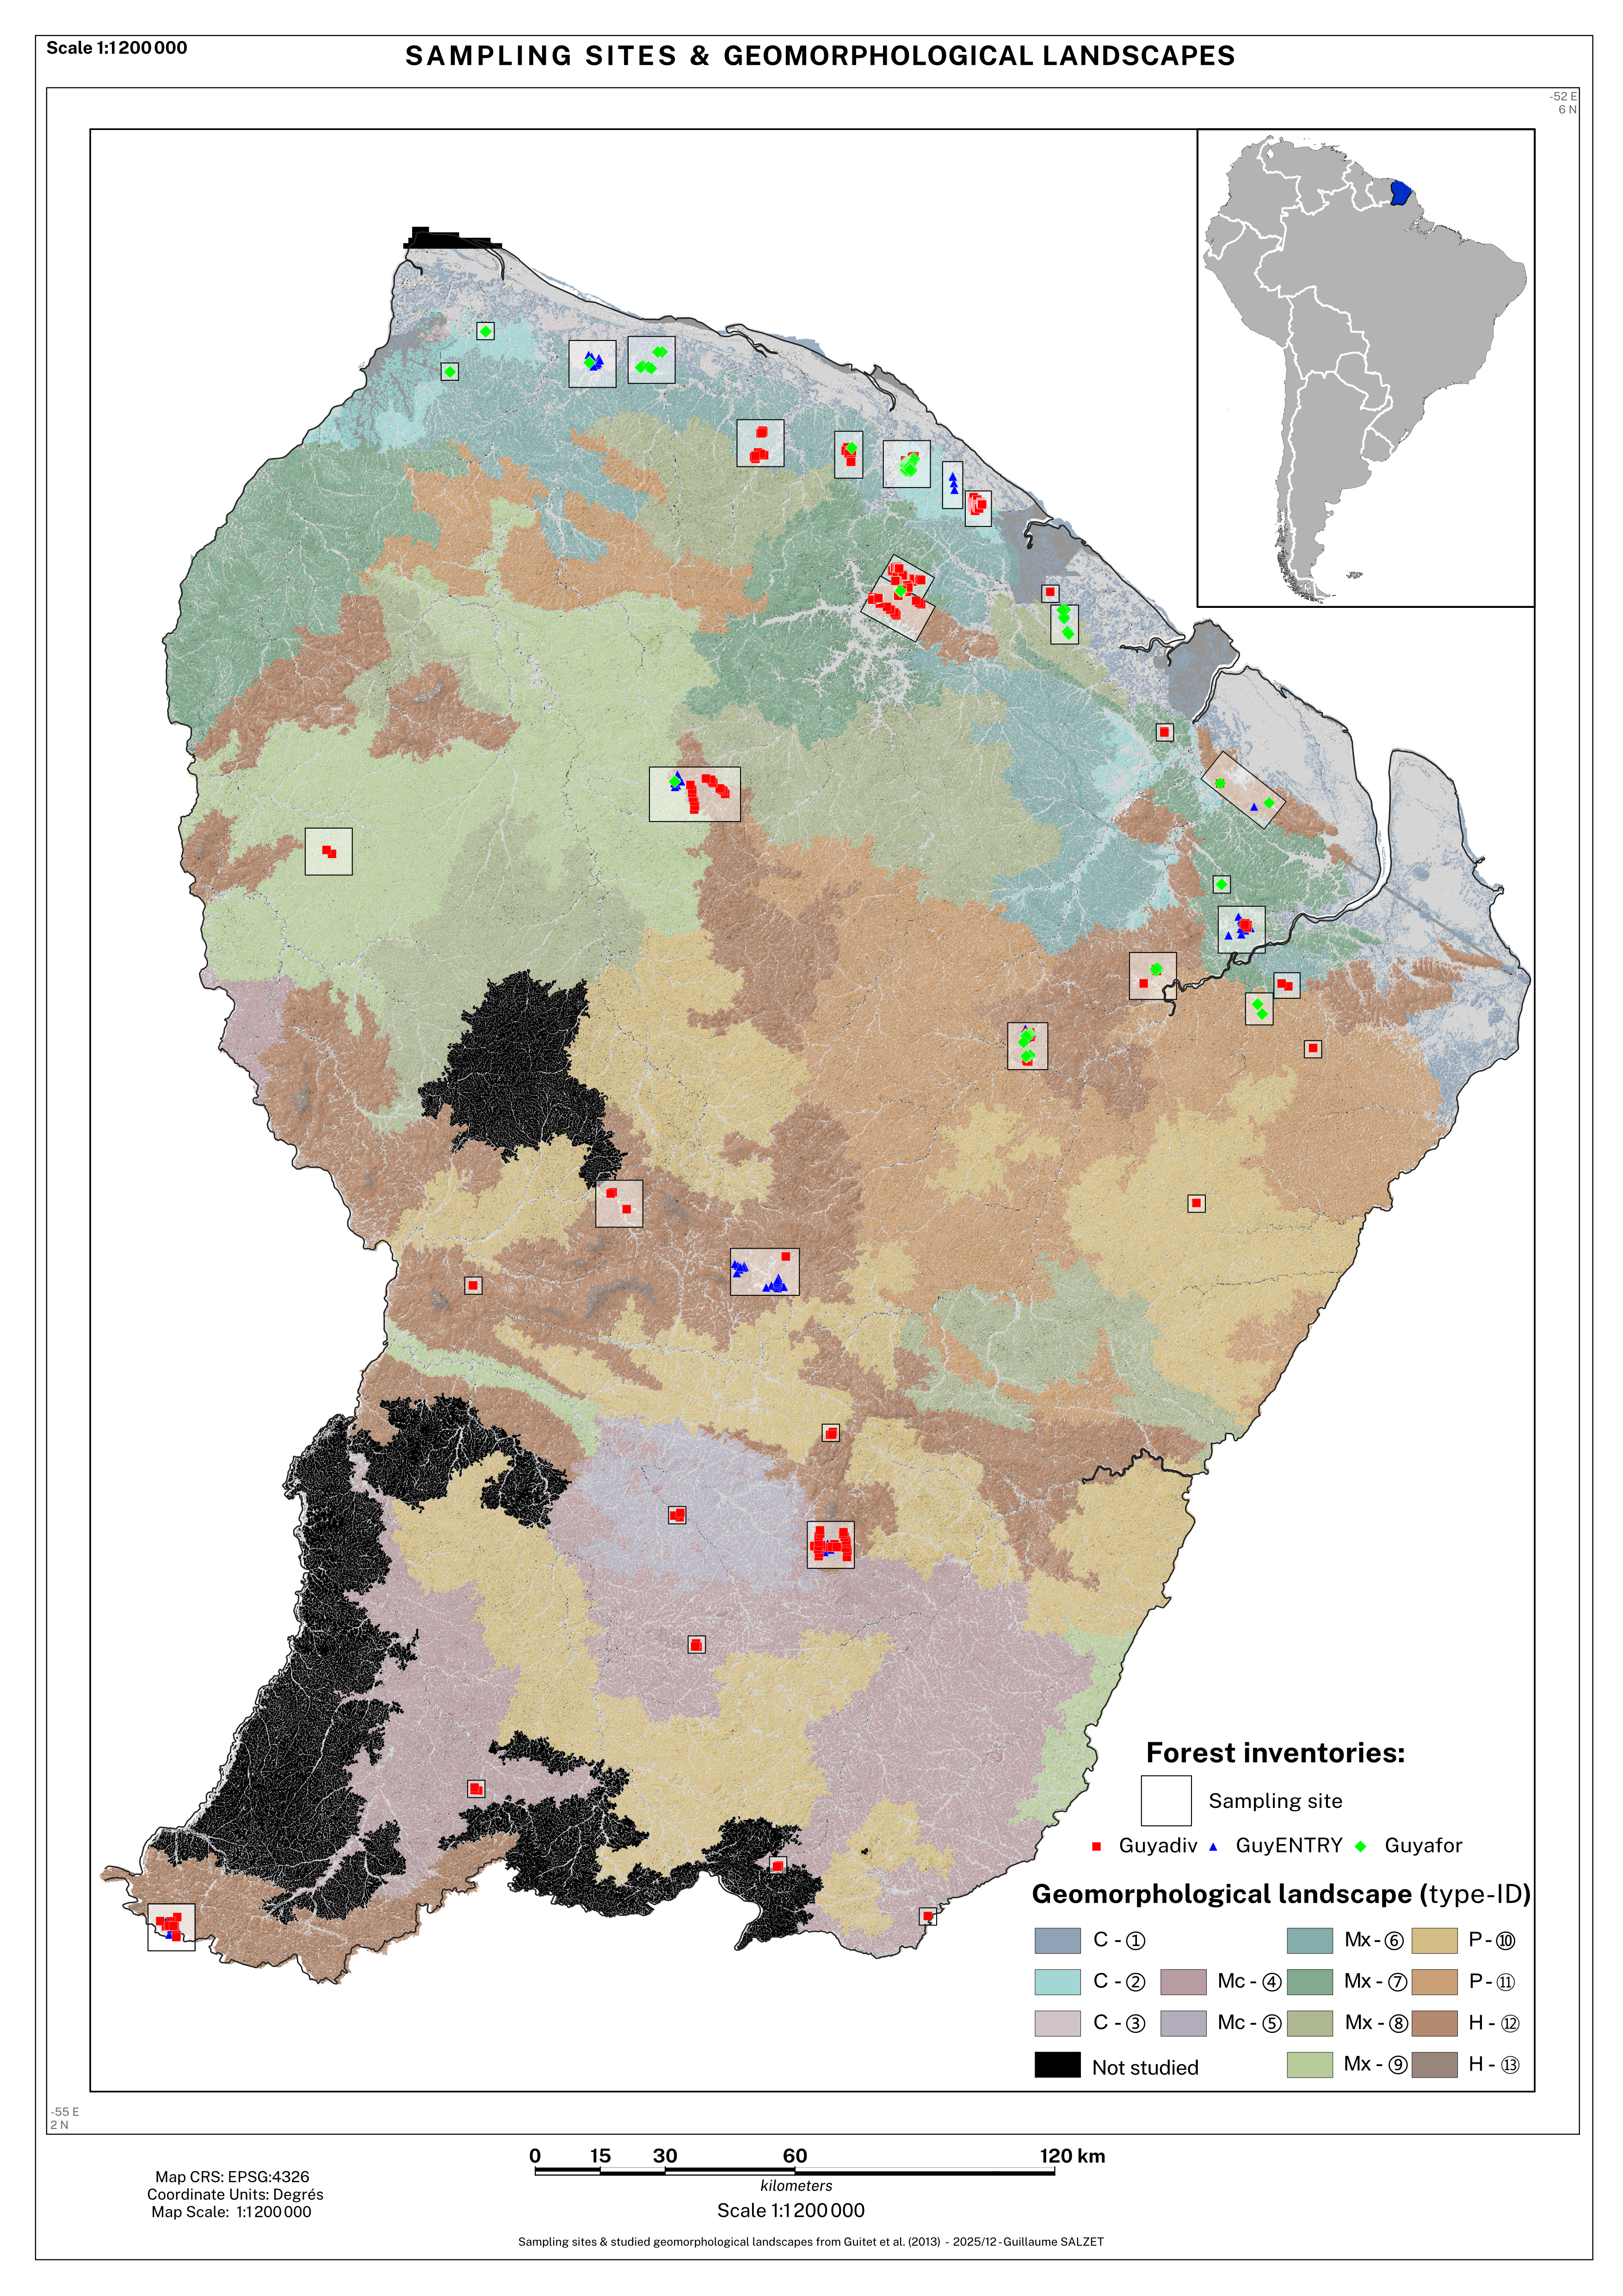
Figure 1: Locations of forest inventory plots across geomorphological landscapes of French Guiana.
The study was conducted across French Guiana (2-6° N, 51-54° W). The average temperature is around 26° C and precipitation ranging from 2000 mm in the south and extreme northwest to more than 4000 mm in the northeast is distributed in wet and dry seasons episodically perturbed by El Niño Southern oscillation events (Paget 1999). The geological substrate and associated landforms derive from the granitic Guiana shield (Hammond 2005; Kroonenberg, Jébrak, and Heuret 2020). Relief is generally subdued (mean elevation: 140 m), with a maximum of 831 m at Mt Bellevue. The geomorphology of the granitic substrate comprises a diverse set of landscapes forming a mosaic of plateaus, multiconvex hills, and valley bottoms associated with strong soil contrasts, analogous to terra firme and seasonally flooded topo-edaphic conditions (Guitet et al. 2013, 2015).
Evergreen ombrophilous forest covers more than 90% of the 83,000 km² territory (de Granville 1985; Gond et al. 2011), harbouring 1783 recorded tree species in 415 genera and 87 families (Molino et al. 2022). The French Guiana floristic background is deeply imprinted by the general Amazonian floristic background (11 % to 13 % of the 15,300 species recorded in the basin) and that of the Guiana Shield (20 % of species are endemic to the Guiana Shield), and has its own endemism rate of 5 % (Guitet, Brunaux, and Molino 2021; ter Steege et al. 2020). Within communities, species composition is marked by a group of 50 hyperdominant species (30 % of 50 % of stems inventoried at the regional level), but whose abundance per species does not exceed 15 % to the stand level. Taxonomic composition varies along regional gradients: coastal forests are dominated by Chrysobalanaceae, Lecythidaceae and slow-growing, hard-wooded Fabaceae, whereas southern forests are richer in Burseraceae, Urticaceae, and fast-growing Fabaceae species of the mimosoid clade (Guitet et al. 2018). In addition, white-sand forests occur in the northwestern sector (Blancaneaux et al. 1972), with a distinctive floristic assemblage (Baraloto et al. 2021).
Inventory data
Key definition
An inventory unit is the statistical sampling unit used in analyses (i.e. the polygon or subplot for which tree and palm abundances and environmental predictors are summarised). Where original plots are larger than the modelling unit, plots are subdivided into subplots and these subplots are treated as inventory units.
A sampling site is a named spatial group (“Site” in the metadata) that aggregates neighbouring inventory units (potentially from different networks) within the same forest area. Sampling sites are used to stratify model training and external validation so that validation units remain geographically independent from the corresponding training units.
Inventory networks
The inventory units come from three forest inventory networks: GuyaDiv (Molino, Sabatier, and Engel 2024), Guyafor (Mirabel et al. 2025), and GuyENTRY (Baraloto et al. 2021), covering the territory of French Guiana and resulting from a collective effort by field ecologists and botanists since 1980 (Figure 2). These three forest inventory networks gather respectively 1,739, 537 and 78 inventory units covering a cumulative area of 183 ha, 291 ha and 38.5 ha.
Code
Shp_plots |>st_drop_geometry() |>group_by(DB) |>summarise(`# inventory units`=n(),`Minimum area (ha)`=min(Area, na.rm =TRUE),`Median area (ha)`=median(Area, na.rm =TRUE),`Maximum area (ha)`=max(Area, na.rm =TRUE) ) |>rename(`Inventory network`= DB)|>gt() |>fmt_number(columns =c(`Minimum area (ha)`, `Median area (ha)`, `Maximum area (ha)`), decimals =3) |>opts_theme()
Table 1: Distribution of inventory-unit surface area (ha) by network.
Inventory network
# inventory units
Minimum area (ha)
Median area (ha)
Maximum area (ha)
GuyENTRY
77
0.100
0.100
0.100
GuyaDiv
1682
0.010
0.030
2.000
GuyaFor
222
0.062
1.000
6.000
57,043, 158,344 and 11,056 individuals are inventoried, with a taxonomic identification rate at the species level of 98%, 68% and 82.5% in the GuyaDiv, Guyafor and gentry network plots respectively, and 100% at the genus level for all individuals. Species-name homogenisation relied on the R package WorldFlora version 2024-12-20 (Kindt 2020), and on the species list of French Guiana (Molino et al. 2022).
Figure 2: Interactive map of inventory units across French Guiana. Colours indicate inventory network and marker outline indicates the train/validation split.
Figure 3: Phylogenetic tree of the studied specie selection among identified tree and palm species in French Guiana
Estimating species’ environmental preferences requires a minimum number of occurrences across inventories and presence in distinct sites. We therefore excluded species with fewer than 30 total occurrences and presence in fewer than 10 distinct inventory units. Under these criteria, 569 species in 237 genera and 63 families were retained.
Data description
The final inventory dataset covers a cumulative area of 517 ha divided into 2,307 forest inventory units of various shapes and sizes. Each inventory unit consists of the measurement of the abundance of palm trees and trees ≥ 10 cm DBH (i.e. diameter at breast height, 1.30 m above the ground). To limit the taxonomic identification error, we selected the most recent available census for each inventory unit (reference census year).
A total of 1,981 inventory units had no missing data, representing 226,443 distinct individuals. The 175,675 individuals measured and identified to species span 88 families, 370 genera, and 1,732 species. We studied 569 species in 237 genera and 63 families, representing 83.9% of inventoried individuals and 31.9% of the described trees and palms species from the French Guiana checklist (Molino et al. 2022). The excluded individuals from retained inventory units are gathered in a unique class.
Baraloto, Christopher, Jason Vleminckx, Julien Engel, Pascal Petronelli, Nállarett Dávila, Marcos RÍos, Elvis Harry Valderrama Sandoval, et al. 2021. “Biogeographic History and Habitat Specialization Shape Floristic and Phylogenetic Composition Across Amazonian Forests.”Ecological Monographs 91 (4): e01473. https://doi.org/10.1002/ecm.1473.
Blancaneaux, Philippe, Jean-Luc Thiais, Gabriel Laplanche, and Jean-Jacques Rostan. 1972. “Podzols et sols ferrallitiques dans le Nord-Ouest de la Guyane française.” Cayenne: ORSTOM.
de Granville, Jean-Jacques de. 1985. “Les formations végétales de la bande côtière de Guyane française.” In Congrès Régional de la SEPANGUY; Colloque SEPANRIT, 47–63. Le littoral guyanais : fragilité de l’environnement. SEPANGUY.
Gond, Valéry, Vincent Freycon, Jean-François Molino, Olivier Brunaux, Florent Ingrassia, Pierre Joubert, Jean-François Pekel, et al. 2011. “Broad-Scale Spatial Pattern of Forest Landscape Types in the Guiana Shield.”International Journal of Applied Earth Observation and Geoinformation 13 (3): 357–67. https://doi.org/10.1016/j.jag.2011.01.004.
Guitet, Stéphane, Olivier Brunaux, and Jean-François Molino. 2021. “Diversité et écologie des arbres en forêt guyanaise.” In Guide des arbres de Guyane, 1:34–45. Cayenne, France: Office national des forêts.
Guitet, Stéphane, Jean-François Cornu, Olivier Brunaux, Julie Betbeder, Jean-Michel Carozza, and Cécile Richard-Hansen. 2013. “Landform and Landscape Mapping, French Guiana (South America).”Journal of Maps 9 (3): 325–35. https://doi.org/10.1080/17445647.2013.785371.
Guitet, Stéphane, Raphaël Pélissier, Olivier Brunaux, Gaëlle Jaouen, and Daniel Sabatier. 2015. “Geomorphological Landscape Features Explain Floristic Patterns in French Guiana Rainforest.”Biodiversity and Conservation 24 (January). https://doi.org/10.1007/s10531-014-0854-8.
Guitet, Stéphane, Daniel Sabatier, Olivier Brunaux, Pierre Couteron, Thomas Denis, Vincent Freycon, Sophie Gonzalez, et al. 2018. “Disturbance Regimes Drive The Diversity of Regional Floristic Pools Across Guianan Rainforest Landscapes.”Scientific Reports 8 (1): 3872. https://doi.org/10.1038/s41598-018-22209-9.
Hammond, David S., ed. 2005. Tropical Forests of the Guiana Shield: Ancient Forests in a Modern World. Wallingford: CABI Publ.
Kindt, Roeland. 2020. “WorldFlora: An R Package for Exact and Fuzzy Matching of Plant Names Against the World Flora Online Taxonomic Backbone Data.”Applications in Plant Sciences 8 (9): e11388. https://doi.org/10.1002/aps3.11388.
Kroonenberg, Salomon, Michel Jébrak, and Arnauld Heuret. 2020. “Géologie protérozoïque du Bouclier des Guyanes.”Géologues, no. 206 (September): 14–22.
Mirabel, Ariane, Géraldine Derroire, Caroline Bedeau, Olivier Brunaux, Jérôme Chave, and Gaëlle Jaouen. 2025. “Guyafor network, permanent forest plots for long-term monitoring of French Guiana’s forest ecosystems.” CIRAD Dataverse. https://doi.org/10.18167/DVN1/WDLCRH.
Molino, Jean-François, Daniel Sabatier, and Julien Engel. 2024. “The GUYADIV Dataset.” DataSuds. https://doi.org/10.23708/RLYCVQ.
Molino, Jean-François, Daniel Sabatier, Pierre Grenand, Julien Engel, Dawn Frame, Piero G. Delprete, Marie Fleury, et al. 2022. “An Annotated Checklist of the Tree Species of French Guiana, Including Vernacular Nomenclature.”Adansonia 44 (26): 345–903. https://doi.org/10.5252/adansonia2022v44a26.
Paget, Dominique. 1999. “Etude de la diversité spatiale des écosystèmes forestiers guyanais : Réflexion méthodologique et application.” PhD thesis, Kourou, France: Ecole Nationale du Génie Rural, des Eaux et des Forêts.
ter Steege, Hans, Paulo I. Prado, Renato A. F. de Lima, Edwin Pos, Luiz de Souza Coelho, Diogenes de Andrade Lima Filho, Rafael P. Salomão, et al. 2020. “Biased-Corrected Richness Estimates for the Amazonian Tree Flora.”Scientific Reports 10 (1): 10130. https://doi.org/10.1038/s41598-020-66686-3.
Source Code
---title: "Study area and forest inventories"format: html: code-fold: true---```{r setup, include=FALSE}knitr::opts_chunk$set( fig.align = "center", fig.retina = 3, fig.width = 6, fig.height = (6 * 0.618), out.width = "80%", collapse = TRUE, dev = "ragg_png")options( digits = 3, width = 120, dplyr.summarise.inform = FALSE, knitr.kable.NA = "")here_rel <- function(...) { fs::path_rel(here::here(...))}``````{r libraries-data, warning=FALSE, message=FALSE}library(tidyverse)library(readr)library(gt)library(gtExtras)library(leaflet)library(sf)library(terra)source(here_rel("R", "funs_data.R"))source(here_rel("R", "funs_graphics.R"))source(here_rel("R", "funs_plot_tables.R"))theme_set(theme_public())```# Study site```{r}#| label: fig-geomorphology#| fig-align: center#| fig-cap: "Locations of forest inventory plots across geomorphological landscapes of French Guiana."hab_map <-here_rel("notebook", "figs", "Habitat_map.png")if (file.exists(hab_map)) knitr::include_graphics(hab_map)```The study was conducted across French Guiana (2-6° N, 51-54° W). The average temperature is around 26° C and precipitation ranging from 2000 mm in the south and extreme northwest to more than 4000 mm in the northeast is distributed in wet and dry seasons episodically perturbed by El Niño Southern oscillation events [@pagetEtudeDiversiteSpatiale1999]. The geological substrate and associated landforms derive from the granitic Guiana shield [@hammondTropicalForestsGuiana2005; @kroonenbergGeologieProterozoiqueBouclier2020]. Relief is generally subdued (mean elevation: 140 m), with a maximum of 831 m at Mt Bellevue. The geomorphology of the granitic substrate comprises a diverse set of landscapes forming a mosaic of plateaus, multiconvex hills, and valley bottoms associated with strong soil contrasts, analogous to terra firme and seasonally flooded topo-edaphic conditions [@guitetLandformLandscapeMapping2013; @guitetGeomorphologicalLandscapeFeatures2015].Evergreen ombrophilous forest covers more than 90% of the 83,000 km² territory [@degranvilleFormationsVegetalesBande1985; @gondBroadscaleSpatialPattern2011], harbouring 1783 recorded tree species in 415 genera and 87 families [@molinoAnnotatedChecklistTree2022]. The French Guiana floristic background is deeply imprinted by the general Amazonian floristic background (11 % to 13 % of the 15,300 species recorded in the basin) and that of the Guiana Shield (20 % of species are endemic to the Guiana Shield), and has its own endemism rate of 5 % [@guitetDiversiteEcologieArbres2021; @tersteegeBiasedcorrectedRichnessEstimates2020]. Within communities, species composition is marked by a group of 50 hyperdominant species (30 % of 50 % of stems inventoried at the regional level), but whose abundance per species does not exceed 15 % to the stand level. Taxonomic composition varies along regional gradients: coastal forests are dominated by *Chrysobalanaceae*, *Lecythidaceae* and slow-growing, hard-wooded *Fabaceae*, whereas southern forests are richer in *Burseraceae*, *Urticaceae*, and fast-growing *Fabaceae* species of the mimosoid clade [@guitetDisturbanceRegimesDrive2018]. In addition, white-sand forests occur in the northwestern sector [@blancaneauxPodzolsSolsFerrallitiques1972], with a distinctive floristic assemblage [@baralotoBiogeographicHistoryHabitat2021a].# Inventory data```{r}#| echo: false#| message: falsePlot_table_path <-here_rel("data", "inventory_data", "Plot_description.csv")Shp_plots_path <-here_rel("data", "shp", "GF_sampling.shp")Guyane_path <-here_rel("data", "shp", "guyane.shp")Plot_table <-read_csv2(Plot_table_path)Shp_plots <-read_sf(Shp_plots_path, quiet =TRUE)Guyane <-read_sf(Guyane_path, quiet =TRUE) |>st_transform("EPSG:4326")```## Key definitionAn **inventory unit** is the statistical sampling unit used in analyses (i.e. the polygon or subplot for which tree and palm abundances and environmental predictors are summarised). Where original plots are larger than the modelling unit, plots are subdivided into subplots and these subplots are treated as inventory units.A **sampling site** is a named spatial group (“Site” in the metadata) that aggregates neighbouring inventory units (potentially from different networks) within the same forest area. Sampling sites are used to stratify model training and external validation so that validation units remain geographically independent from the corresponding training units.## Inventory networksThe inventory units come from three forest inventory networks: GuyaDiv [@molinoGUYADIVDataset2024], Guyafor [@mirabelGuyaforNetworkPermanent2025a], and GuyENTRY [@baralotoBiogeographicHistoryHabitat2021a], covering the territory of French Guiana and resulting from a collective effort by field ecologists and botanists since 1980 (@fig-inventories). These three forest inventory networks gather respectively 1,739, 537 and 78 inventory units covering a cumulative area of 183 ha, 291 ha and 38.5 ha. ```{r}#| label: tbl-plots#| tbl-cap: "Distribution of inventory-unit surface area (ha) by network."Shp_plots |>st_drop_geometry() |>group_by(DB) |>summarise(`# inventory units`=n(),`Minimum area (ha)`=min(Area, na.rm =TRUE),`Median area (ha)`=median(Area, na.rm =TRUE),`Maximum area (ha)`=max(Area, na.rm =TRUE) ) |>rename(`Inventory network`= DB)|>gt() |>fmt_number(columns =c(`Minimum area (ha)`, `Median area (ha)`, `Maximum area (ha)`), decimals =3) |>opts_theme()```57,043, 158,344 and 11,056 individuals are inventoried, with a taxonomic identification rate at the species level of 98%, 68% and 82.5% in the GuyaDiv, Guyafor and gentry network plots respectively, and 100% at the genus level for all individuals. Species-name homogenisation relied on the R package *WorldFlora* version 2024-12-20 [@kindtWorldFloraPackageExact2020], and on the species list of French Guiana [@molinoAnnotatedChecklistTree2022].```{r}#| label: fig-inventories#| fig-cap: "Interactive map of inventory units across French Guiana. Colours indicate inventory network and marker outline indicates the train/validation split."#| column: screen-inset-rightLat_Saul <-3.6163888889Lon_Saul <--53.2011111111# Fill color = inventory networkpal_net <-colorFactor(palette =c("red", "darkgreen", "navy"),domain =c("GuyaDiv", "GuyaFor", "GuyENTRY"))# Outline = train/validationpal_split <-colorFactor(palette =c("white", "darkred"),domain =c("train", "validation"))leaflet(Shp_plots) |>setView(lng = Lon_Saul, lat = Lat_Saul, zoom =7.5) |>addProviderTiles("Esri.WorldStreetMap") |>addCircleMarkers(lng =~Lon, lat =~Lat,label =~as.character(PlotID),fillColor =~pal_net(DB),color =~pal_split(type),fillOpacity =0.8, opacity =1,weight =2, radius =4,popup =~paste0("<strong>Inventory unit ID: </strong>", PlotID, "<br>","<strong>Network: </strong>", DB, "<br>","<strong>Sampling site: </strong>", Site, "<br>","<strong>Area (ha): </strong>", Area, "<br>","<strong>Protocole: </strong>", Protocole, "<br>","<strong>Reference census year: </strong>", RefCensus, "<br>","<strong>Train/validation: </strong>", type, "<br>" ) ) |>clearControls() |>addLegend(position ="topright",pal = pal_net, values =~DB,title ="Inventory network (inside)",opacity =0.8 ) |>addLegend(position ="bottomright",pal = pal_split, values =~type,title ="Train/validation (outline)",opacity =0.8 )```## Studied species list ```{r}#| echo: false#| message: falselibrary(U.PhyloMaker)Species_list_path <-here_rel("data", "inventory_data", "Species_list.csv")Species_list <-read_csv2(Species_list_path) |>rename(SpEpithet=specie, species=taxonomic_name) |>select(species, genus, family,selected)if (file.exists(here_rel("data", "inventory_data", "tree_GF.rds"))) { treeGF <-readRDS(here_rel("data", "inventory_data", "tree_GF.rds"))} else { megatree <-read.tree("https://github.com/megatrees/plant_20221117/raw/refs/heads/main/plant_megatree.tre") gen.list <-read.csv("https://github.com/megatrees/plant_20221117/raw/refs/heads/main/plant_genus_list.csv", sep =",")# Correction for modified genus between megatree / species list (Molino et al. 2022). splist_cor <- Species_list splist_cor$genus <-gsub("Marlimorimia","Inga",splist_cor$genus) splist_cor$species <-gsub("Marlimorimia","Inga",splist_cor$species) splist_cor$genus <-gsub("Robrichia","Enterolobium",splist_cor$genus) splist_cor$species <-gsub("Robrichia","Enterolobium",splist_cor$species) splist_cor$genus <-gsub("Gwilymia","Entada",splist_cor$genus) splist_cor$species <-gsub("Gwilymia","Entada",splist_cor$species) treeGF <-phylo.maker(splist_cor,megatree, gen.list, nodes.type =1, scenario =3) treeGF$sp.list$genus <-gsub("Entada","Gwilymia",treeGF$sp.list$genus) treeGF$sp.list$species <-gsub("Entada","Gwilymia",treeGF$sp.list$species) treeGF$phylo$tip.lab <-gsub("Entada","Gwilymia",treeGF$phylo$tip.lab) treeGF$sp.list$genus <-gsub("Enterolobium","Robrichia",treeGF$sp.list$genus) treeGF$sp.list$species <-gsub("Enterolobium","Robrichia",treeGF$sp.list$species) treeGF$phylo$tip.lab <-gsub("Enterolobium","Robrichia",treeGF$phylo$tip.lab) treeGF$sp.list$species[which(treeGF$sp.list$species %in% splist_cor$species[which(Species_list$genus =="Marlimorimia")])] <- Species_list$species[which(Species_list$genus =="Marlimorimia")] treeGF$sp.list$genus[which(treeGF$sp.list$species %in% splist_cor$species[which(Species_list$genus =="Marlimorimia")])] <-"Marlimorimia" treeGF$phylo$tip.lab[which(treeGF$phylo$tip.lab %in%gsub(" ","_",splist_cor$species[which(Species_list$genus =="Marlimorimia")]))] <- Species_list$species[which(Species_list$genus =="Marlimorimia")]saveRDS(treeGF,here_rel("data", "inventory_data", "tree_GF.rds"))}treeGF$phylo$tip.label <-gsub("_", " ", treeGF$phylo$tip.label)phylodata <- phylobase::phylo4d(treeGF$phylo, data.frame(species =gsub("_", " ", treeGF$phylo$tip.label)) |>left_join(treeGF$sp.list |>mutate(selected =factor(selected)) |>select(species,selected)))``````{r}#| label: fig-ggtree#| fig-cap: "Phylogenetic tree of the studied specie selection among identified tree and palm species in French Guiana"if(!file.exists(here_rel("notebook", "figs", "phylo_GF.png"))){ g <- ggtree::ggtree(phylodata, layout ="fan", size =0.5, aes(color = selected)) + ggtree::geom_tiplab(size =0.5, align =TRUE, linesize = .5) +scale_colour_manual(values =c("0"="grey75", "1"="darkred", "NA"="grey25"), limits =c("0","1"))+labs(color ="Selected species") +theme(legend.position ="bottom") +theme_void()ggsave(plot = g, filename =here_rel("notebook", "figs","phylo_GF.png"), bg ="white", width =10,height =10, dpi =1500)} knitr::include_graphics(here_rel("notebook", "figs","phylo_GF.png"))```Estimating species’ environmental preferences requires a minimum number of occurrences across inventories and presence in distinct sites. We therefore excluded species with fewer than 30 total occurrences and presence in fewer than 10 distinct inventory units. Under these criteria, 569 species in 237 genera and 63 families were retained.## Data descriptionThe final inventory dataset covers a cumulative area of 517 ha divided into 2,307 forest inventory units of various shapes and sizes. Each inventory unit consists of the measurement of the abundance of palm trees and trees ≥ 10 cm DBH (*i.e.* diameter at breast height, 1.30 m above the ground). To limit the taxonomic identification error, we selected the most recent available census for each inventory unit (reference census year).A total of **1,981 inventory units had no missing data**, representing **226,443 distinct individuals**. The 175,675 individuals measured and identified to species span 88 families, 370 genera, and 1,732 species. We studied **569 species** in 237 genera and 63 families, representing 83.9% of inventoried individuals and 31.9% of the described trees and palms species from the French Guiana checklist [@molinoAnnotatedChecklistTree2022]. The **excluded individuals** from retained inventory units are gathered in a **unique class**.```{r}#| tbl-cap: "Summary of the forest inventory datasets by network and sampling site, including sampling effort and associated data repositories."Plot_table |>mutate(Reference = glue::glue("<br><span style='font-size:50%'>({Reference})</span>"),`Data reference`= glue::glue("<br><span style='font-size:50%'>({`Data reference`})</span>",DOI = glue::glue("<br><span style='font-size:50%'>{DOI}</span>")) ) |>gt() |>cols_align(align ="left") |>opts_theme() |>opt_interactive(use_compact_mode =TRUE, use_highlight =TRUE, use_filters =TRUE) |>opts_theme()```